
Building a data pipeline for eazyBI reports
A few weeks ago, we were thrilled to be invited to speak at eazyBI Community Days 2018.
We had a blast meeting fellow Atlassian Partners, vendors, and customers from around the world, as well as sightseeing the beautiful host city of Riga, Latvia. We heartily recommend next year’s installment of Community Days to anyone interested in implementing advanced reporting and gathering business intelligence in Jira, using eazyBI’s excellent Reports and Charts add-on.
For those of you who missed this event, you can watch our talk on YouTube.
In this article, we would like to expand upon the ideas covered in our talk, and demonstrate some of the technical ins & outs of building a data pipeline for eazyBI reports.
The Data
The typical use case for the eazyBI add-on is to provide business intelligence based on project & issue data imported from Jira. However, eazyBI also includes a REST API connector, enabling data imports from virtually any source, provided the data:
- can be consumed over a REST endpoint; and
- can be served in a JSON, XML, or CSV representation.
This opens up a myriad of possibilities for providing Jira users with integrated reports on performance figures across the wider business. Crucially, it also leaves you - the solution architect - with two key considerations:
- the volume of stored data, and
- the volume of processed data.
The Why
You will quickly notice that, while you can compensate for the volume of stored data by throwing more/better hardware at the problem, you may not necessarily be able to do so with the data processed by eazyBI. This is chiefly the case when:
- the data you are reporting on does not in itself contain the required metrics; and
- the metrics themselves require a non-trivial amount of computation.
Our recommended solution to this problem is pre-processing the data prior to importing it into eazyBI.
The Dos & Don’ts
When and when not to pre-process?
Our rule of thumb is: leverage the power of eazyBI’s calculated members as much as possible; pre-process only when not doing so would negatively impact on the user experience.
If you have previously deferred to spreadsheets for reporting purposes, you may be used to scrolling around multiple complicated tables, each filled with complex formulas and cross-references, all working overtime to present you with desired results.
In many cases, attempting to recreate this model in eazyBI goes against the spirit of its design.
- The add-on is a web application, subject to the same limitations and considerations as any app or website whose job is to render data in a performant and accessible manner inside a web browser’s window.
- The data itself is stored in a multi-dimensional OLAP cube, updated and expanded at regular intervals. This makes it more suitable for “dynamic reporting”, where figures and metrics are extracted from the cube in the form of a query, and the results rendered on-screen in a format according to need.
Of course, keeping the above considerations in mind is no guarantee for smooth sailing.
Sometimes, you might want to have a comprehensive all-in-one-place view of a specific data subset and assorted metrics; other times, computing complex metrics on-the-fly using calculated members may lead to browser timeouts even for a relatively narrow view of the data. In both scenarios, you can ease the computational burden on eazyBI by pre-computing the desired metrics in advance.
The How
To demonstrate this on a practical example, we will show you how to build a cached data pipeline using a number of Jira apps we know & love.
- We will use the Tempo suite as our data source. Tempo provides us with a set of add-ons to capture workload management, planning, and budgeting information within Jira. Some of its data is available in eazyBI directly using the Jira application import functionality; however, getting our hands on most of the data requires the use of the REST API import in eazyBI.
- We will use Adaptavist ScriptRunner for Jira as our processing engine. ScriptRunner enables us to extend, customize, and automate Jira with purpose-built scripts written in the Groovy programming language, leveraging any available Java and REST interfaces.
- And of course, we will use eazyBI Reports and Charts for Jira for our business intelligence reporting solution!
The Source
Our data source will consist of financial portfolio metadata as provided by the Tempo Budgets app. In Tempo Budgets, Jira project cost & revenue information is stored inside corresponding project folios. To help define our data domain, let’s ask:
- where should we get our data from; and
- what metrics would we like to report on?
Figures
Let’s suppose our users would like the following figures and assorted metadata pulled into a consolidated eazyBI report:
- Folio name
- Parent portfolio name
- Start & end date
- Quoted Days (a folio custom field)
Metrics
Let’s further assume that there is a need to report on the following calculated metrics.
- Planned Days, defined as the planned staff effort within the folio time frame.
- Actual Days, defined as the sum total of days worked to date by the folio staff within the folio time frame.
- Remaining Days, i.e. the sum total of remaining time estimates across all unresolved issues in the folio scope.
- Total Days, i.e. the sum total of original time estimates across all issues in the folio scope.
The Engine
Now that we have defined our data domain, how do we get the data out of Tempo Budgets and pre-process it in a format suitable for eazyBI?
In order to compute the metrics and present all this data to eazyBI in a single data source, we must create our own API endpoint to serve the data over.
Inputs
No single screen in the Tempo Budgets UI gives us the information we need in a consolidated manner: we will therefore need to dig a little deeper in order to get our hands on the data. This is where REST API calls come into play.
Tempo Budgets provides official documentation for supported API calls. We can use the following calls to retrieve desired folio figures and metadata:
- /rest/tempo-planning/1/api/portfolio
- /rest/tempo-planning/1/api/folio
- /rest/tempo-planning/1/api/folio/{folioId}
At the time of this writing, the public API does not provide direct access to any of our calculated metrics. This is of course fully expected, as we have defined these metrics ourselves. However, we can get our hands on the underlying data in another manner, by utilising private API calls.
Note that whether private or experimental, non-public APIs are subject to change. We advise exercising caution when using these as part of your solution, keeping in mind any eventual maintenance implications.
There are a couple of ways to discover undocumented calls:
- using Atlassian’s REST API Browser;
- using developer tools inside your web browser.
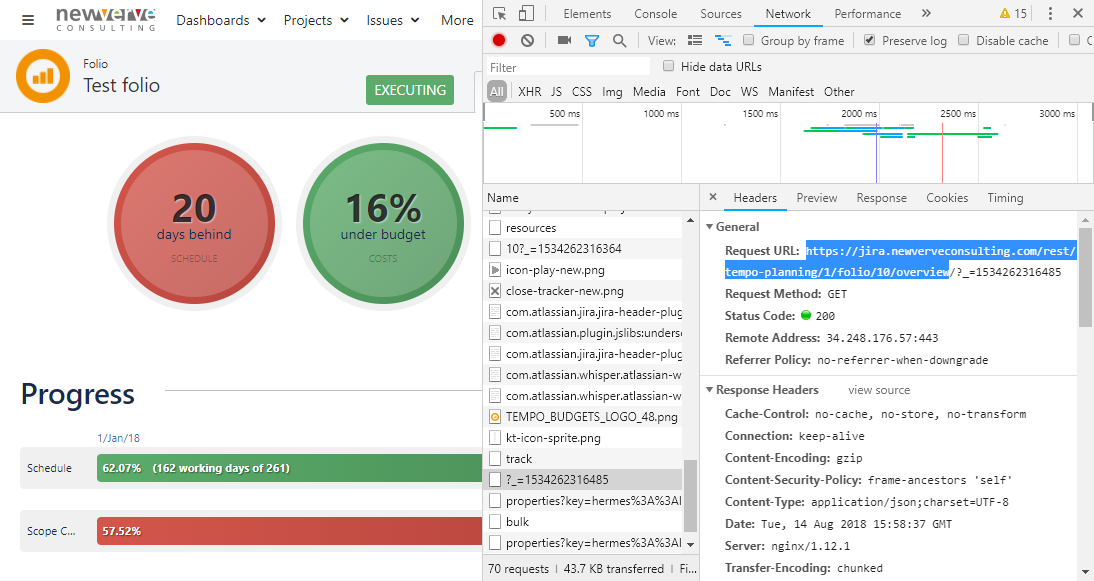
See below for an example of what a private REST API call to the Tempo back-end looks like in the Google Chrome DevTools, with the REST endpoint highlighted in blue on the right-hand side panel.
In our case, the relevant API calls are:
- /rest/tempo-planning/1/folio/{folioId}/overview
- /rest/tempo-planning/1/team/planningStatus/{folioId}
- /rest/tempo-planning/1/team/worklogs/{folioId}
Outputs
Adaptavist ScriptRunner for Jira provides us with the facilities to create scripted services and custom REST endpoints. Backed by purpose-written Groovy scripts, these will allow us to:
- pre-process all required data on our own schedule; and
- cache it for subsequent import into eazyBI.
For small data sets, we would not expect to have to pre-process our data in advance: we would simply do so on-the-fly inside our custom endpoint, and use that endpoint to import data into eazyBI in one fell swoop.
However, since our data domain may be relatively large, doing so would only lead to API timeouts, with eazyBI waiting for all the data to be processed. This consideration is especially relevant when building reports which track data over time, where the size of the data domain is multiplied by the granularity of the time dimension.
Service
Our scripted service will do the heavy lifting, performing the following operations:
- retrieving relevant data from Tempo Budgets;
- calculating additional metrics;
- storing the results in a format suitable for subsequent retrieval.
There are a number of ways to store these results, ranging from using a local database, uploading data into the cloud, or leveraging whatever storage is available at the application level. For the purpose of this exercise, we will use the latter option, and save the data to a Jira user property.
You can grab some sample code from our public Bitbucket repository here: generate_folio_report-sample.groovy.
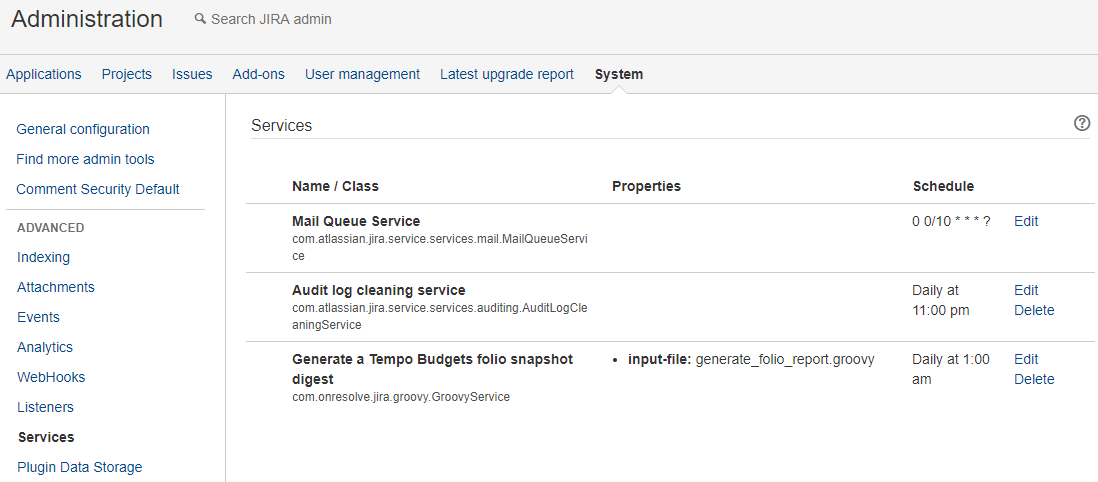
We will configure the scripted service in Jira under Administration → System → Services as follows, executing overnight and outside of standard office hours.
Endpoint
Our custom endpoint will provide a thin wrapper around the Jira user property, allowing eazyBI to retrieve the data stored therein.
You can grab some sample code from our public Bitbucket repository here: get_folio_report-sample.groovy.
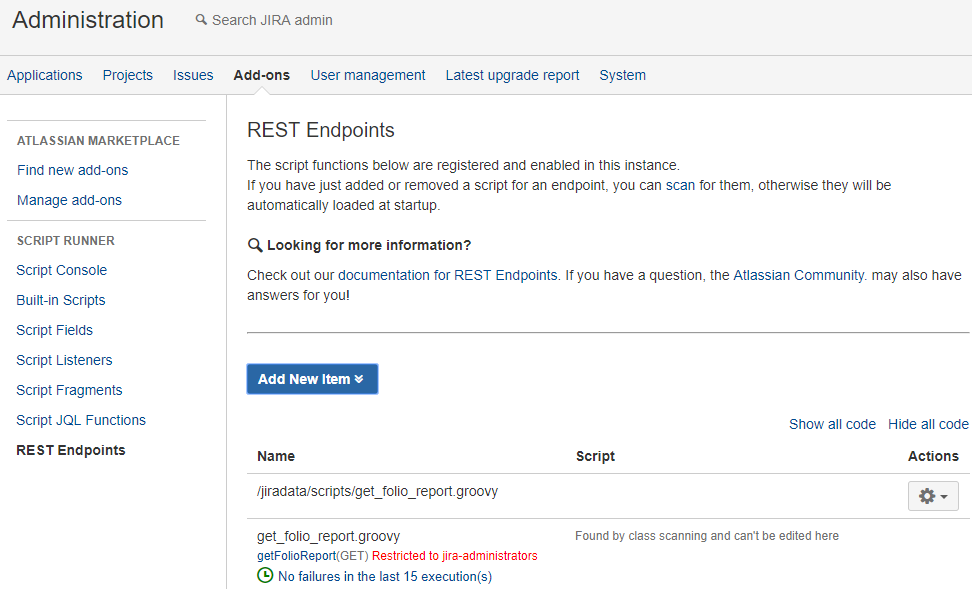
We will configure the custom endpoint in Jira under Administration → Add-ons → REST Endpoints as follows. Note that in the screenshot, the underlying Groovy script has been deployed directly into the script roots on the back-end server, and as such cannot be previewed or modified inline.
The Report
With our data pre-processing engine in place, it is now time to import the results into eazyBI.
Import
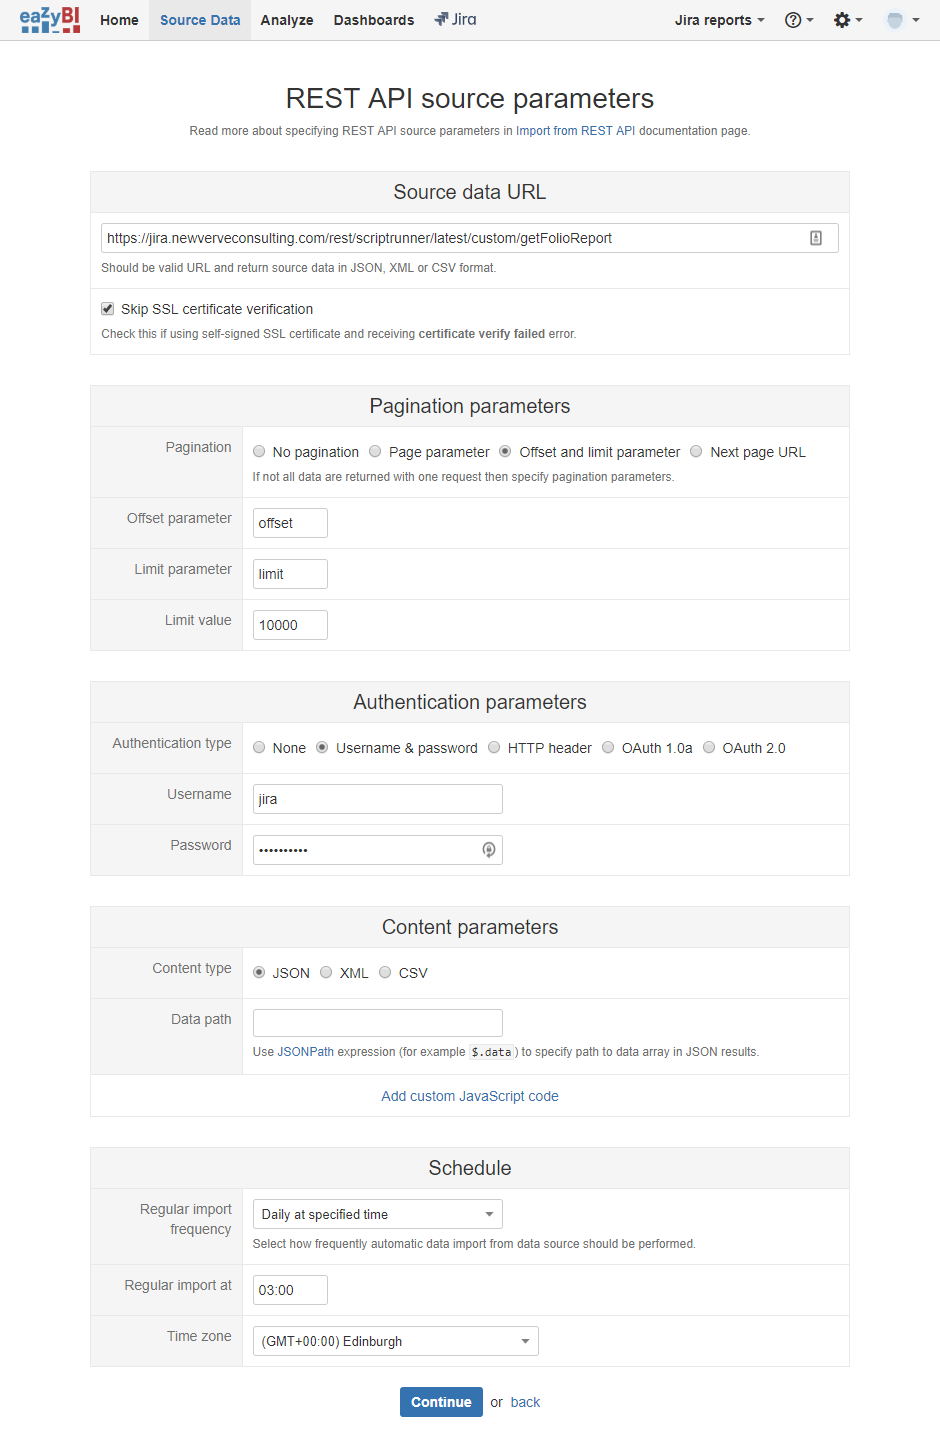
We will configure a new application import in eazyBI under Source Data → Add new source application. We select {REST:API} as our import type.
See below for example import parameters. Note that the import will also occur overnight, outside of standard office hours, following the execution of our scripted service.
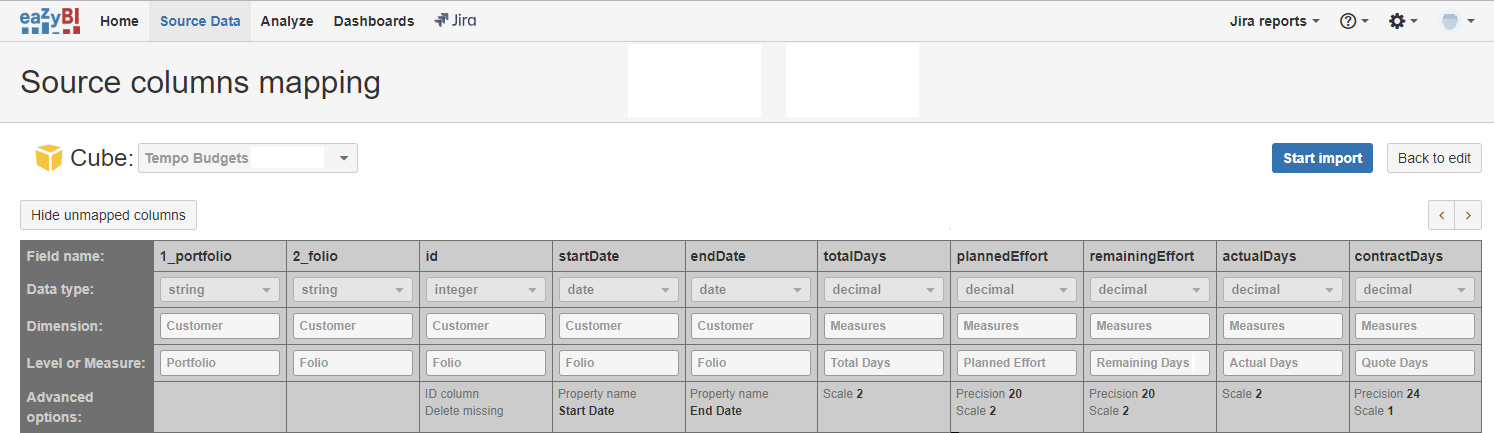
Our custom endpoint, as specified in the parameters, will serve us JSON data in the following format.
[ { "1_portfolio": "Test portfolio", "2_folio": "Test folio", "id": 478, "startDate": "2014-01-01", "endDate": "2018-06-30", "totalDays": 314.81, "plannedEffort": 0, "remainingEffort": 314.81, "actualDays": 0, "contractDays": 309.1 } ]
The source columns mapping for the above JSON will then look as follows.
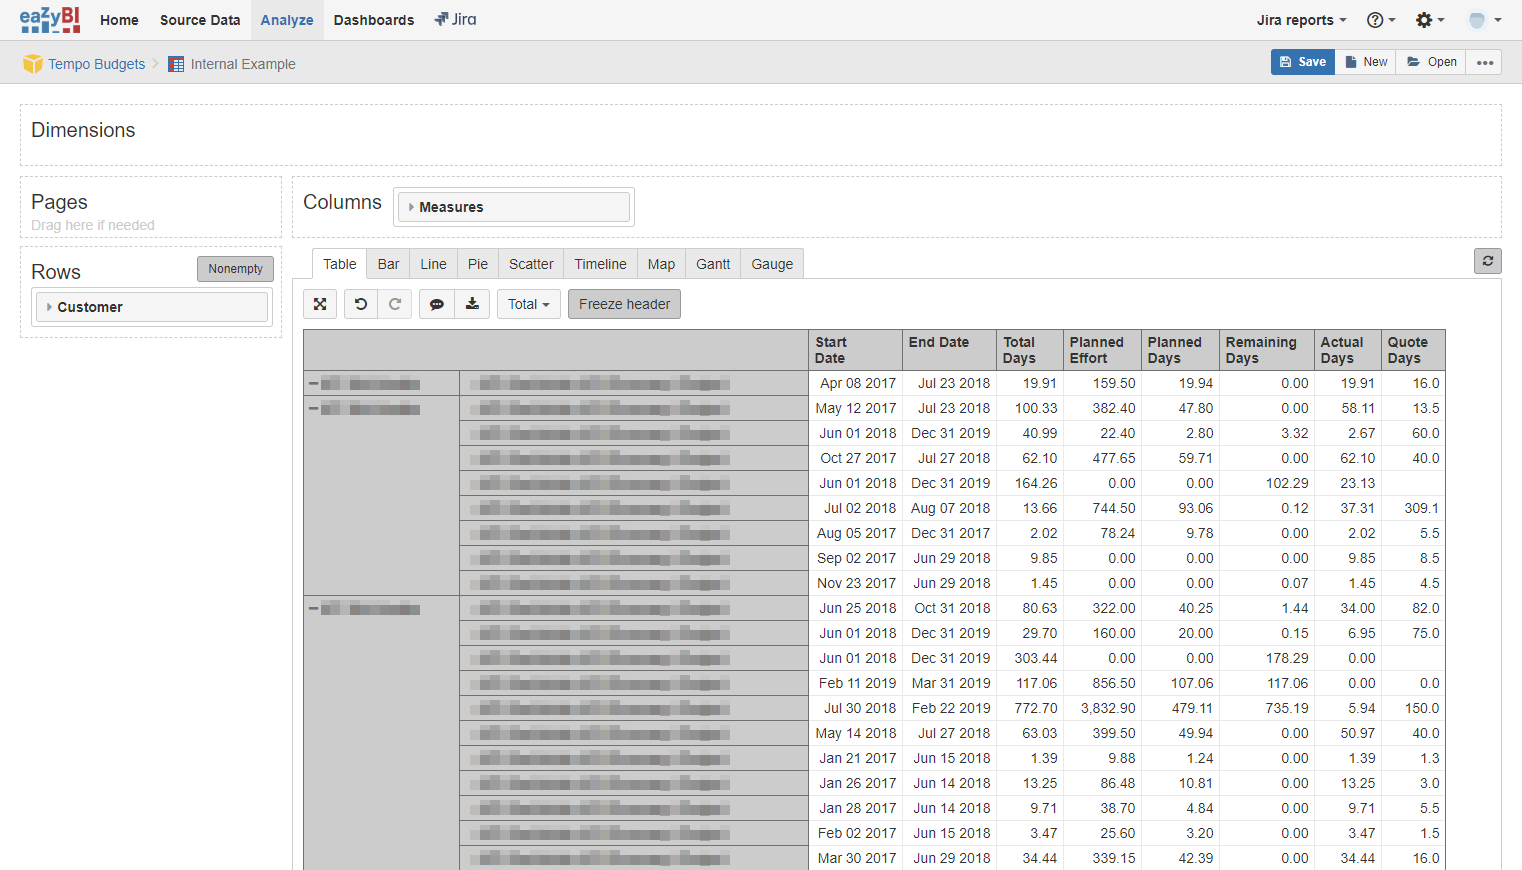
Presentation
In the resulting eazyBI report, we can expose all imported columns as follows. Note that, because the Planned Effort measure is given in hours, we will create a calculated member called Planned Days, where:
[Measures].[Planned Days] = [Measures].[Planned Effort] / 8
In Summary
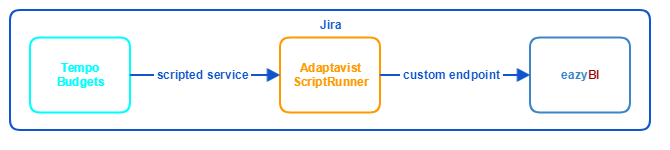
The overall data flow across our pipeline can be visualised as follows.
We hope this article and the examples contained therein will help guide you through the process of setting up a similar pipeline of your own, tailored to your unique needs. If you require any assistance with getting the most out of Jira & eazyBI, do get in touch and we will be happy to help set you on the path!
Related Reading
If you enjoyed this blog, you may also enjoy EazyBI Remote Community Day 2020
Comments:
There are no comments for this entry yet.